So I’m attempting to utilize Fluentcontrol’s sample tracking add-on to generate reports following a worklist. We tend to run long worklists, and there are situations where the source well may have insufficient volume and instead of stopping to prompt the user on how to proceed, we ignore the errors. We now want to get a report out at the end that will tell us at which transfer step did a volume detection error occur in the source well.
I’m having issues understanding the data in these reports. It seems like they show the accumulated error codes for every source well. But, I want to know at which specific transfer step did an error occur. For instance, if in a worklist the same source well is aspirated from 10 times, but ran out of liquid on the 8th transfer, I want to be able to get that information from the report. Not just to know that an error occurred at some point for that well.
Maybe I’m using the wrong reports, but I think I’ve tried them all and none seem to have this type of information.
I want to utilize ST to track samples from source to destination labware and then use that destination labware in a later run. The Tecan website suggests:
“The *.csv report file of a Platemap report file has the correct format so it can also be used to Register a labware with a Platemap file in a future run if you continue to process the same plate in a future run and have Sample Tracking Embedded.”
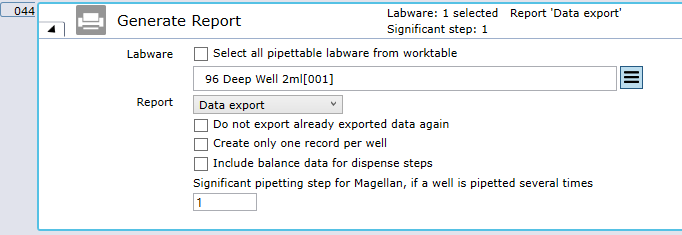
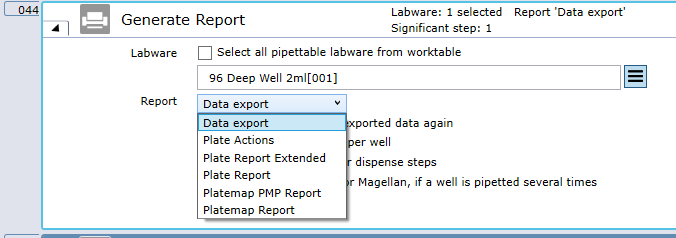
I do not see an option in Generate Report for this type of output (FC 3.5). The platemap reports are PDFs by default. Is this an issue of embedded vs standalone (I’m not really sure how to tell which is installed)?
Hi @Sean_M
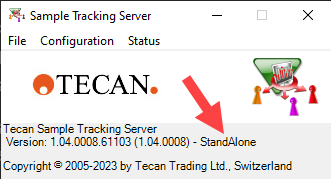
It is labelled on the Sample Tracking Server window whether you have ST ‘Embedded’ or ‘Stand Alone’ installed. Which one you have depends on what option was selected at installation.
ST StandAlone has a persistent database across runs whereas ST Embedded keeps the database content for one run only, meaning at the start of the next run the database is cleared again. But in the future run you could register a plate with a platemap file from a previous run to make the data of that specific plate known to Sample Tracking again in a fresh run when using ST Embedded.
You would do this as following
Run #1
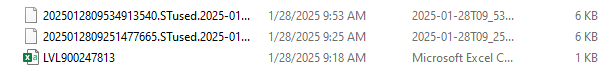
In the script after the plate is processed, select ‘Platemap Report’ and activate the check box ‘Export to csv’ , then it will create as usual the *.pdf report file plus amn additional *.csv report file in the output folder (C:\ProgramData\Tecan\VisionX\Output).
Run #2
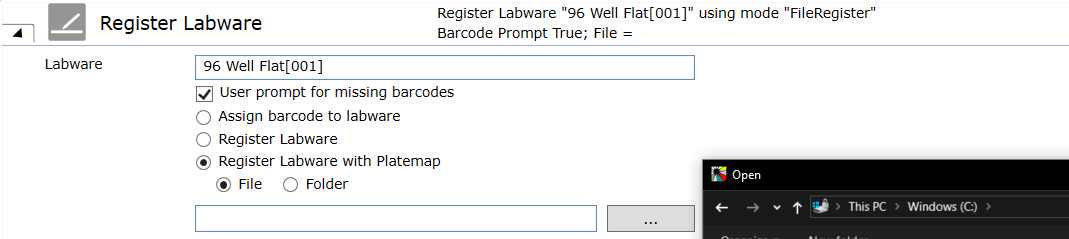
In the script, before using that plate, the platemap *.csv report file with the plate data from Run#1 can then be used when you Register that plate in Run #2 with option ‘Register Labware with Platemap’ and select the *csv platemap report file (or select a folder and it searches for a platemap file with the same plate barcode within the folder)
Thanks this is great, my test script is finding my samples as needed.
It looks like I can edit the path for the .csv reports from the Configure System menu. Is there a way to edit the path for the PDF reports?
I’m also finding that while I can change the path for the .csv reports to somewhere on another network drive, and that works well for ‘Data Export’ reports, it is not writing the .csv export of a ‘Plate Report’ to the network drive. That file appears lost in space if I do not use the default path. There is a ST file created, but no .csv file.
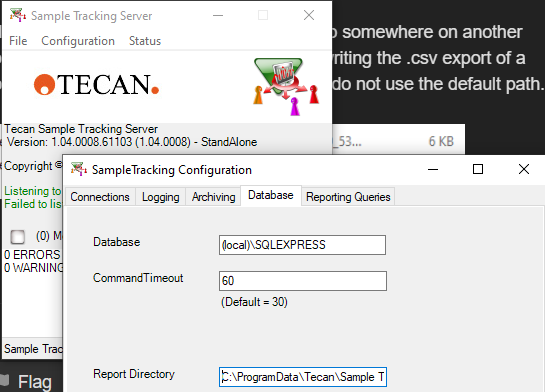
The pdf report directory can be set at the Sample Tracking Server window. I haven’t ever tried to change it, but the setting is there at Sample Tracking Server Configuration → Database tab. I assume it then needs a re-start of Sample Tracking which is easiest by just doing a PC re-start (otherwise manually close ST Server & ST Client and then restart both again manually)
Ok great. All of my reports have an i4 error for each sample “User Manually Scanned Labware.” This is expected as the workflow uses an excel sample info import and hand scanning the labware.
Is there a way to prep ST for manual scanning so that QC does not see errors on each report?
I’m not aware of any setting in Sample Tracking that would suppress or change the occurrentce or severity of Sample Tracking errors.
If the manual scan first gets stored to a FluentControl variable (TouchTools Variable command) and afterwards a SetAttribute() function sets the tube barcode, then there may be no ST Error 4 for manually entering the barcode; on the other hand the user then doesn’t see a worktable graphic with highlighted labware during the scan as for the TouchTools Manual Scan Labware command.
That makes sense. I may need to accept the tradeoff of explaining to QC to ignore the manual scan error so that the users have the better experience with the graphic prompt.
Is there a way to track the sample concentrations through a process beyond the “calculated dilution” that is shown by default?
I am trying to do some sample normalizations, including an option for a 2-step normalization for high concentration samples. The concentrations and sample barcodes are properly imported and assigned for the source samples, but once they are pipetted out of the original plate, I am having difficulty keeping track of the diluted concentrations in ng/uL.
Sample Tracking “should” handle this
but I’ve previously had problems in getting it to work (some times ST hasn’t actually logged any data)
so i went rogue & generated some external code to handle the data analysis portion to generate pipetting logs, new concentrations & link the src barcodes/destination barcodes for a more robust, configureable tracking component for FluentControl
Thanks, it looks like I may need to do something similar here. Things were running so well to this point with ST that I had my hopes up it could manage this as well.
From where do you get the actual concentrations (in ng/ul) ? Magellan Read before Normalization in same script? Or import concentrations from a file that you have before the run starts and the script directly starts with Normalization?
A plate can be registered in ST with a platemap file containing the actual concentrations and actual unit for each well and shall then track the concentrations from there. You could insert multiple ST Generate Report commands at any point in the script to find out if ST ever knew about the actual concentration (in ng/ul) and then replaces them by relative concentrations or if ST never knew the actual concentrations (in ng/ul) in the first place.
I think I have achieved the desired result with Sample Tracking documenting with actual concentration units for 3 nested normalization steps. Like many things with ST I think I know what I did, but I don’t necessarily know why it worked yet. There may very well be a smoother way to make this work, but I thought I would document for those trying this in the future.
Scan all labware barcodes to assign.
Import file with sample names and barcodes.
Loop import and assign values to source wells using SetAttribute commands
Register Source Labware (not with map)
Use SetValues command loops to assign the source well concentration values (again) and concentration units. This step feels redundant, but if either the SetAttribute(concentration) or SetValue commands are removed it breaks.
Perform Primary and Intermediate Normalization Smart Commands
Generate ST Platemap Report of Intermediate Dilution plate
Import concentrations from the newly generated report. This is a little tricky as I have to count how many samples are in this plate so that I import the correct number of rows and then import both the well concentration and position (alpha to numeric conversion). My understanding of ST makes me think this should not be required in theory, and only if you want to track samples across methods. Nonetheless ST had no idea what the concentration was of these samples without another import step.