I have a Bravo workflow comprised of several separate protocol files combined into a runset (via appending, not set at start). It has multiple branching paths, x # of potential deck reloads, and entire sections may or may not occur based on input parameters. Total variance is ~55 minutes.
I’d like to build an estimated remaining runtime display for operators so they know what to expect, but running a simple tkinter countdown script at the start wouldn’t be accurate due to mid-run deck reloads.
Is there any way to extract the internal VWorks time estimation/run progress data and use that inside or outside of the software as a variable?
If the VWorks calcs aren’t usable, then I was thinking of manually logging the individual times for each potential process. Then at the start based on input parameters it generates a list of scheduled processes that will occur during the run and the estimated time for each scheduled process, which will be used to calculate total remaining runtime.
Each time a scheduled process completes, it’s removed from the list. Each change to the list causes it to recalculate its estimate. Countdown is paused during deck reloads.
Maybe the above could work? There might be an easier way though, let me know if anyone has any ideas!
Do you really need actual remaining time or could a percent completion work? You could keep it simple, from vworks have a simple js script that writes the calculated % based of the current protocol, process or iteration to a text file and poll and read that file from you tkinter app.
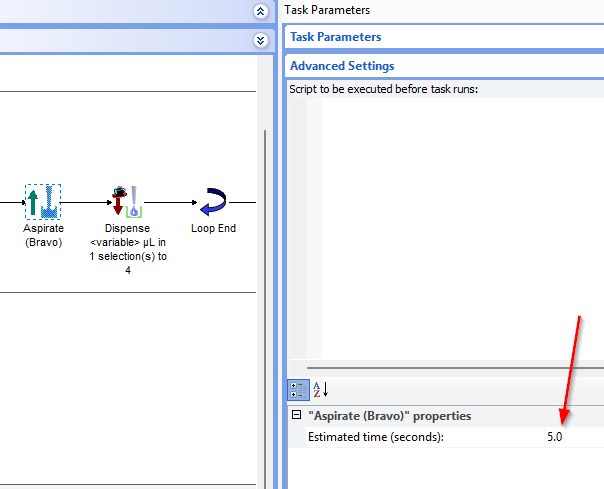
In VWorks the overall simulation time you see in the Gantt chart is calculated using the “estimated times” you can find in the Advanced Settings section of the pipetting (and other) tasks:
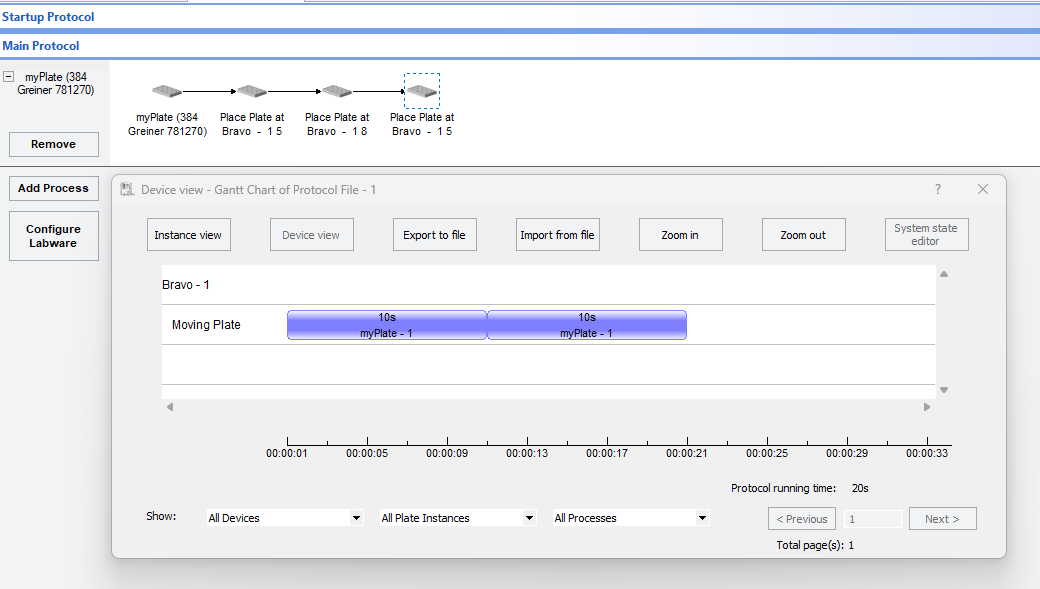
These times are normally updated when you run the protocol for real and used for other simulations. They are just estimates… nothing more than that. You can edit these times according to your needs and obtain more reliable estimates. Not all tasks have estimated times, one important example being “place plates” and in this case the VWorks simulator uses some hardcoded standard times:
I would say that the most important reason why we have simulation is for checking protocols before running them for real and that’s a feature I use all the time.
OK I have just realized that yours was a different question. Anyway, you could use the same approach and build a table of estimated times for each task used in your protocol. Depending on the input some tasks will run and other tasks will not. Of course you’ll have to take into account liquid classes during ASP/DISP/MIX and loops, but this is not impossible as you know exactly what your protocol will be doing.
Thank you both for the advice! Displaying % completion is a good idea, I think i’ll shoot for implementing it alongside the remaining runtime.
Since I can’t snag the estimated runtime from Vworks for each run, i’ll just do a few runs and use the log or GAANT chart to get the actual times for each process. Not a big deal.
Let me know if you have any other ideas or feedback!