Hi all, apologies if this has already been discussed previously
I’m trying to run a development method in simulation, which is an offshoot of one of our already validated methods. Some of the carriers already have some labware built into the model, such as one of our tube carriers
I recently made some new sequences for this carrier, one of which starts at position 1 of the carrier and ends at position 4. When I run in simulation, the image stays static so it doesn’t show where the volume has been pipetted from. This isn’t a problem with most of the other labware on deck, just this one and maybe one other one (that position is a deepwell that had already been pipetted into once, transported somewhere else on deck, transported back, and then pipetted into again)
Anyone know if there is a setting on the labware to toggle on the visualization of pipetting or is it something that has to be modified in labware editor? I tried searching for help when modifying properties but not sure if it has what I need. For clarity, this method isn’t ready to be put on instrument just yet since there are many things in the code that need updating
Are you running in venus 4, venus 6 w/ new UI, or venus 6 with legacy run control? I usually don’t have issues with seeing updated positioning on 6.3 new UI or legacy, however there was a known bug with visualizations prior to 6.3. That said, my work is with different labware so I can’t speak to yours specifically. Have you tried the HSLDeckVisualize library in general?
While you can always review the trace log to see where liquid is pipetted from and to (which would give you the labware IDs, positions, and volumes) the visualization of the pipetting will always happen on the deck layout view as well at runtime. However, the positions of the flat circles or squares that highlight where liquid is being aspirated from or dispensed to is determined by the top of the container/rack definition. This means that if you have a 3D model for a given labware that is a giant block completely enveloping those containers, you may never see any highlighted positions in the deck layout view.
On another note, when running in simulation it may help to set the simulation delay speed to 10 or 20% in the system configuration editor so that the highlighted positions when aspirating and dispensing appear and stay a bit longer.
I’m using venus 4. I think that example I showed is a custom labware definition that has the tubes built in, so maybe that is why the pipetting is not showing from those positions. From the trace I can tell that the pipetting sequence is correct, however, so I’m not too worried about that (I’m recycling another one of our methods) However, had I not looked closely at the trace I wouldn’t’ve noticed originally that the pipetting sequence was initially trying to use all 8 channels to pipette from one position on the tube carrier (which isn’t what I wanted originally)
I’m having a little bit more trouble with one of my deepwells. It’s a little complicated because it is set to not automatically be viewed on deck since the site is initially empty and the deepwell is later transported to that site
I tried to capture a video but seems that I can’t upload it. Just try to visualize this
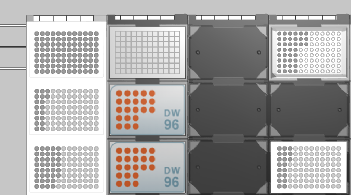
the bottom left is 300uL tips. the action is to pick up tips, aspirate from that topmost deepwell, and then put into the matrix rack at the bottom righthand corner of the image. As you can see, the deepwell looks different from the other deepwells below it, as if it is about to show the pipetting sequence. However, it does not appear that is had been pipetted (I double checked the trace and it did pipette from the topmost deepwell into the matrix rack)
I will investigate this deck visualizer and see if it will help me. Otherwise is there some sort of property or labware definition for this labware I need to fix? the labware is the same as all the other deepwells, which seem to have no problem showing pipetting despite also having some transport steps. I think the only difference is that those deepwells are being dispensed into rather then aspirated out of